
Discover the most common metrics Agile teams can use to measure productivity, improve efficiency, and deliver with more clarity.
In a highly competitive environment, everyone tries to beat the competition and offer innovative solutions first. This is especially true for software products, which puts enormous pressure on development teams to be more productive and efficient. Over the recent years, the wide availability of AI tools in software development has largely increased this pressure.
It’s now more important than ever for Agile teams to measure their productivity and, most importantly, to work on increasing it. This blog post shows the most common metrics Agile teams can implement and use to measure and improve their productivity and efficiency.
What is productivity?
To measure productivity in Agile projects, it’s necessary to define what productivity is. According to Cambridge Dictionary, productivity is the rate at which a company or country makes goods, usually judged in connection with the number of people and the amount of materials necessary to produce the goods.
However, to properly measure, there is a need to distinguish between productivity and efficiency. Productivity is the quantity of output produced. Its focus is on how much work is completed. In software development terms it can be how many features were delivered to customers. Efficiency is the quality and optimization of that output. Here the focus is on producing the biggest output while minimising resources (e.g. amount of hours spent coding and testing the software).
Since productivity and efficiency are tightly connected, this blog post will include both. Agile practitioners and project stakeholders can use these measures to assess the performance of their projects and make corrective actions.
Measuring productivity – Traditional vs Agile
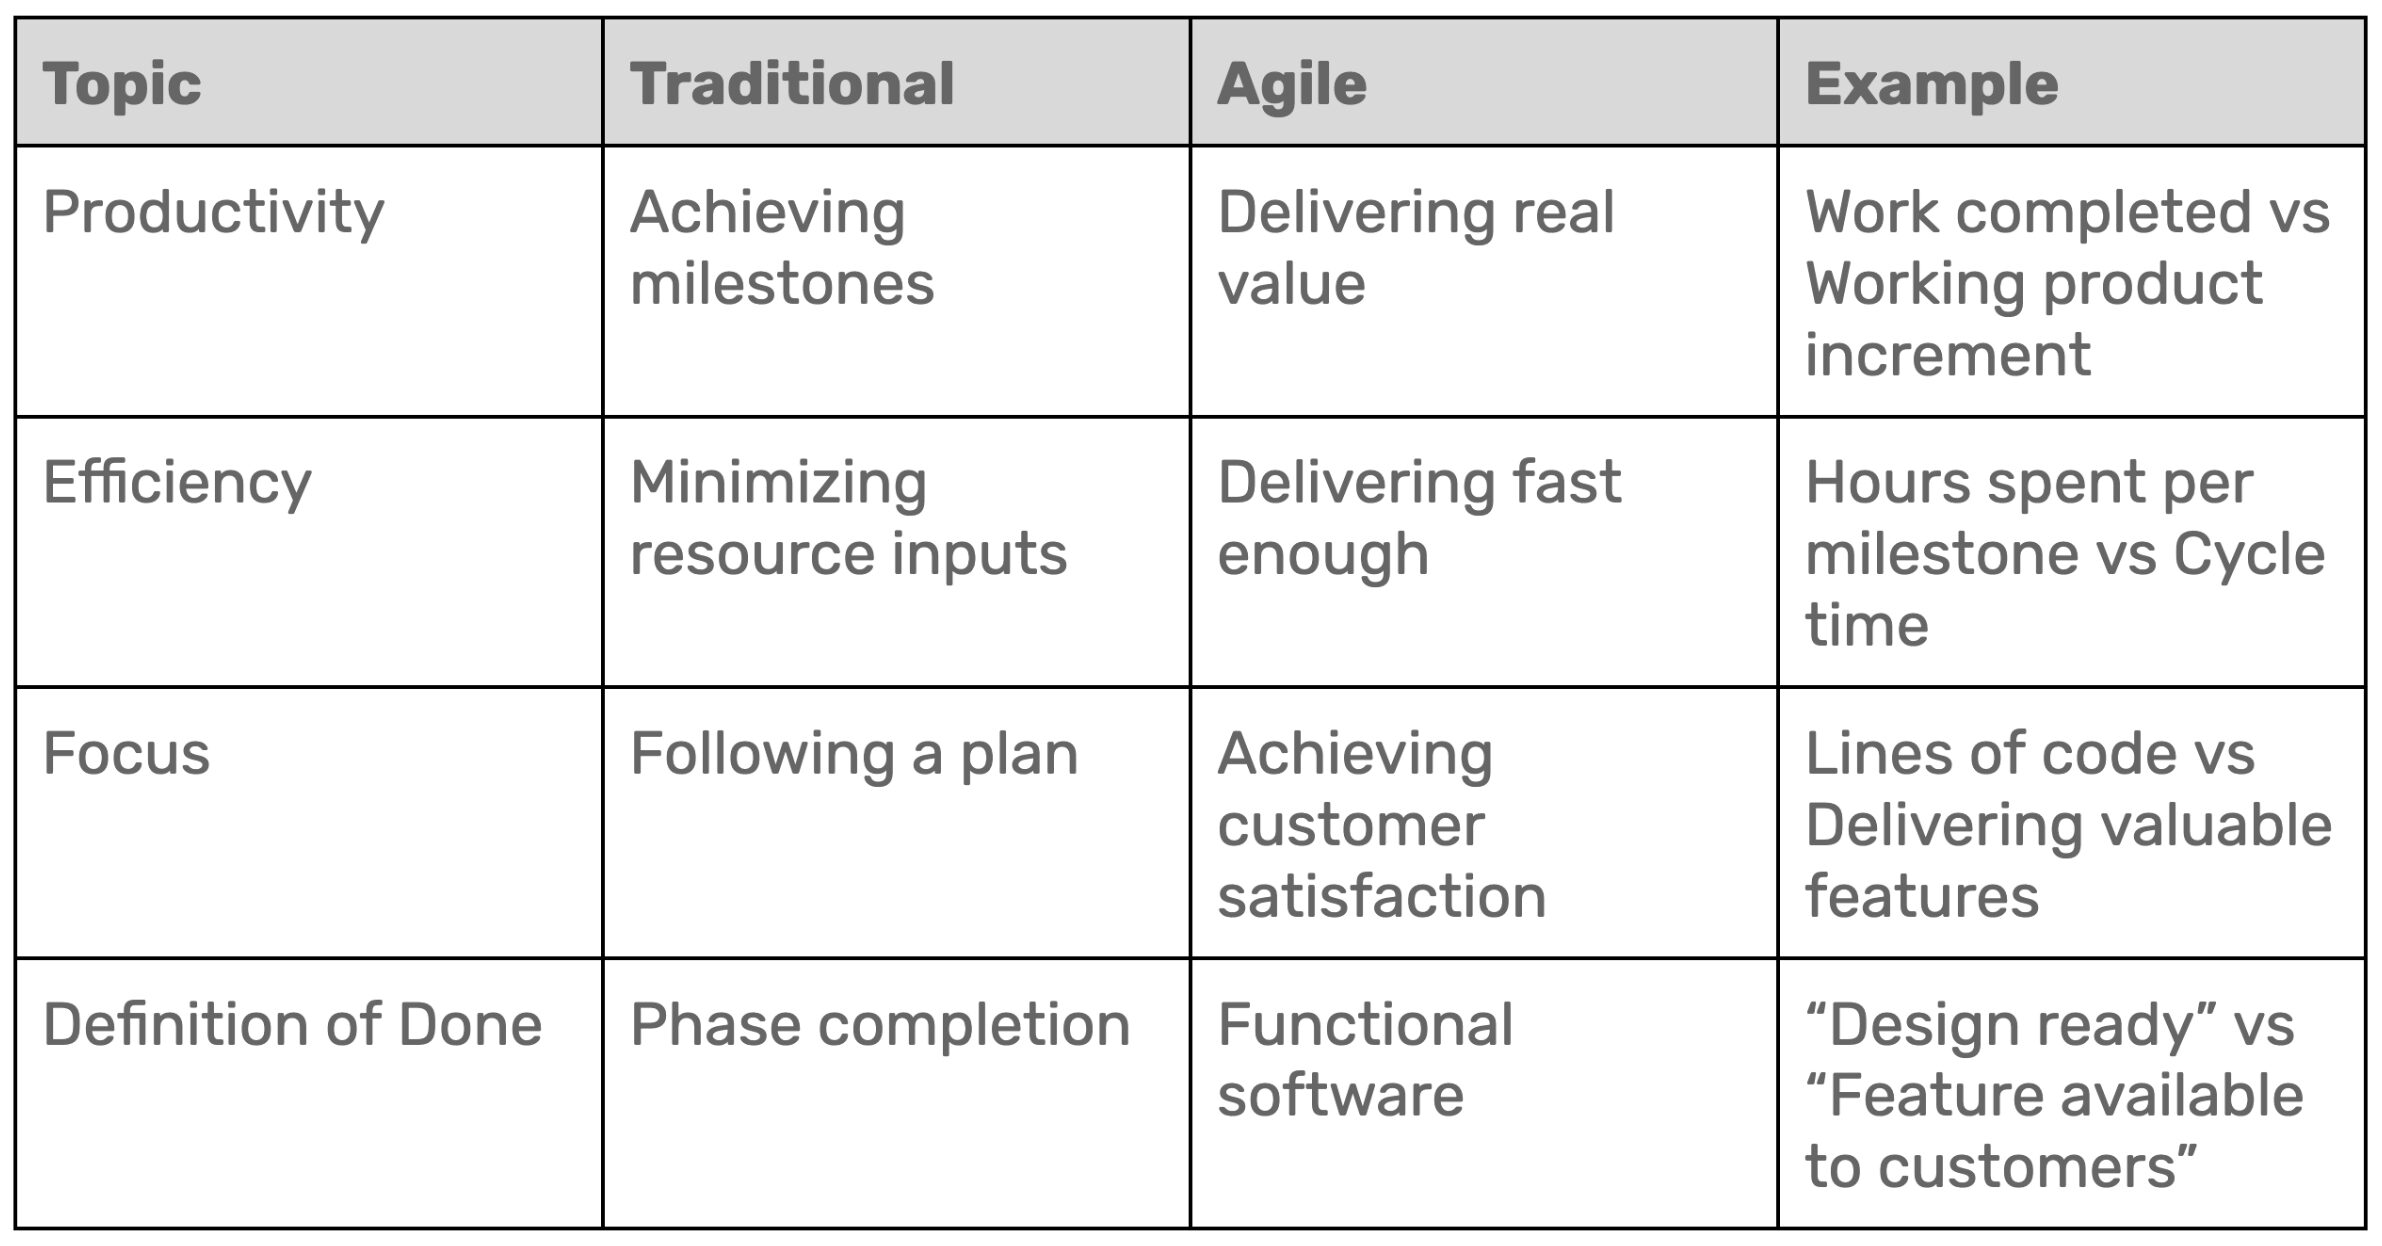
There is a substantial difference between measuring productivity in Agile compared to traditional (waterfall) projects. In traditional Waterfall projects, productivity is often measured according to compliance to a plan. Huge effort invested in upfront project planning and minimum willingness to change during the project execution meant that measuring the plan was (nearly) perfect. Therefore, measure of plan execution is the most important metric.
However, in Agile projects delivery of value (in the form of working software) represents a more important metric. Below you can find a table that shows the most important differences in measuring productivity between traditional and Agile projects.
If you want a more detailed description of differences in traditional and agile projects you can check our blog post that describes in detail how value-driven delivery outperforms traditional project plans.
Common Agile productivity metrics
Most popular productivity metrics used in Agile projects are focused on measuring delivery flow. These are:
- Velocity
- Lead time
- Cycle time
Velocity measures the amount of work a team completes in a sprint, typically using story points. Story point estimate is one of the most widely used metrics in Agile projects. Although story points can be used to measure output, using them as an only measure of productivity can lead to inaccurate data.
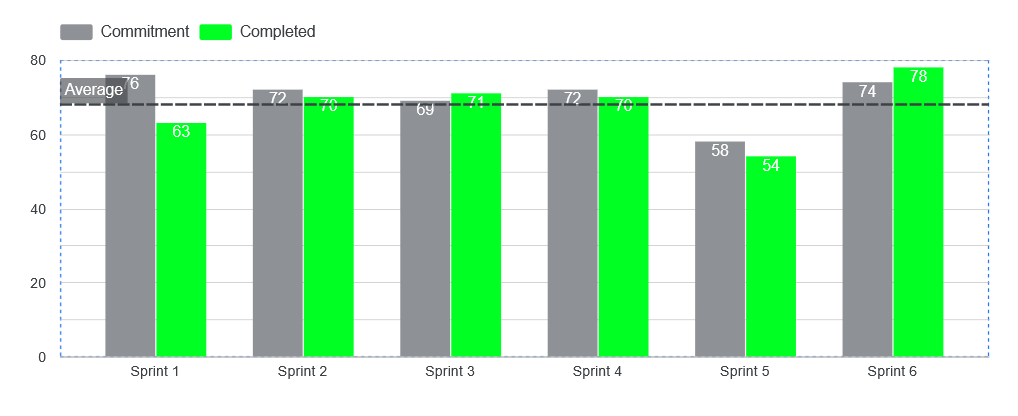
Example of velocity chart comparing commitment and completed story points across 6 sprints. Source: Author
Unlike Velocity, Lead time and Cycle time measure time passed between different phases that work items go into. Lead time measures the total time from initial customer request to delivering the working software to users. Cycle time measures the time from start of the work on that feature request until this request is delivered in the form of working software. Therefore, lead time is part of cycle time, as displayed in the image below.
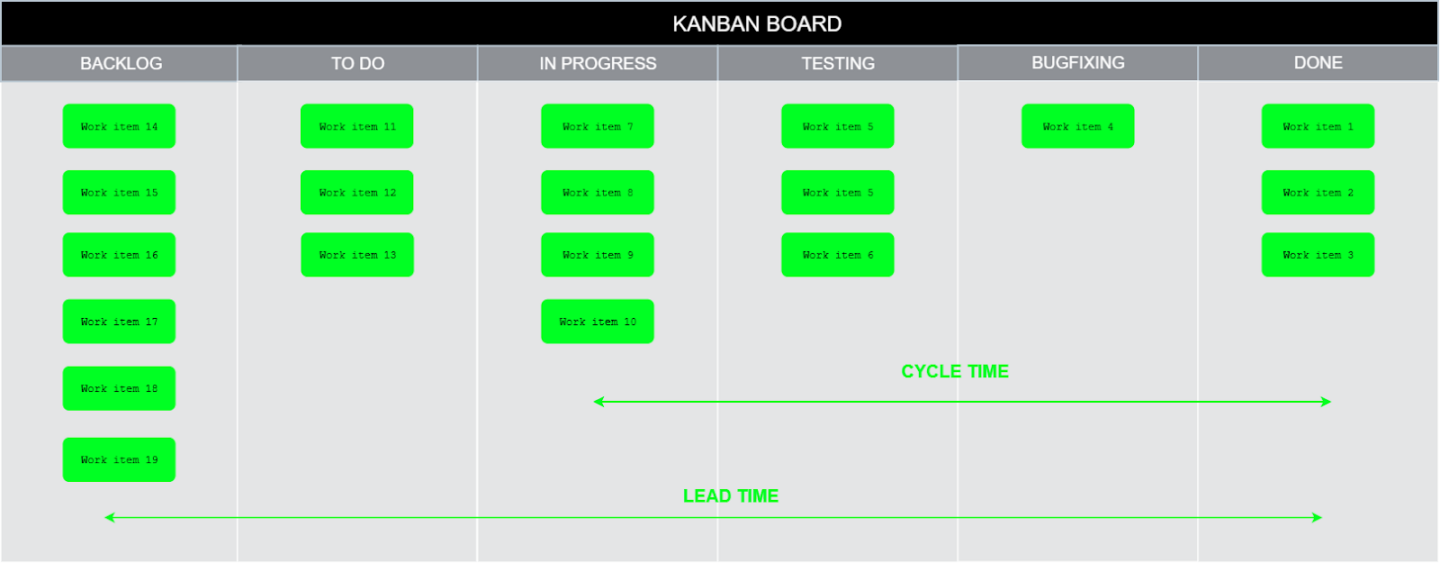
Kanban board showing the difference between lead time and cycle time. Source: Author
Advanced metrics: DORA
While common Agile productivity metrics are focused mostly on team performance and delivery, DevOps mindset offers advanced metrics.
DORA’s DevOps Research and Assessment software delivery performance metrics focus on a team’s ability to deliver software safely, quickly, and efficiently. DORA metrics include two main measurement areas:
- Throughput – measures how many items can be delivered through a given time period.
- Instability – measure of the amount of successful software deployments.
The focus here will be on throughput metrics. DORA uses three factors to measure software delivery throughput:
- Change lead time: The amount of time it takes for a change to go from committed to version control to deployed in production.
- Deployment frequency: The number of deployments over a given period or the time between deployments.
- Failed deployment recovery time: The time it takes to recover from a deployment that fails and requires immediate intervention.
How to incorporate productivity metrics in your Agile project
So far you saw overview of most popular Agile metrics along with some advanced metrics with DevOps mindset. Now it’s time to use them – knowing theory is one thing but practical implementation another. It is also important to know why you are collecting metrics. Using them shouldn’t be a burden for your team, creating immense pressure if their velocity drops for a sprint or two.
Rather than that, metrics should be used to provide a talking point for your Sprint Retrospective where the entire team can discuss how to improve productivity. Below there are 5 steps you can take to incorporate productivity metrics in your Agile project.
Step 1: Select metrics relevant to your project
As first step each you should select metrics to focus on:
- Productivity – Velocity or Throughput (for volume delivered)
- Flow – Lead time and Cycle time (for speed/efficiency)
- Advanced metrics – Change lead time, Deployment frequency and Failed deployment recovery time
Your team can also choose to measure other aspects, such as quality. For example, it can look at the Defect Escape Rate (DER) to measure the percentage of bugs found in the production environment – more details in our next blog posts.
Step 2: Gather data
Once you select the exact metrics you want to use, it’s time to gather data and establish a baseline for you to analyze, compare and look for improvements. Gathering data requires at least 2-3 sprints and then use it to compare and improve.
Step 3: Use advanced metrics
To implement advanced DORA metrics Agile you should integrate data collection directly into your team’s CI/CD pipeline. This will ensure automatic collection of data, removing the need for developers to enter data manually. You can then use tools like GitHub Insights or GitLab Value Stream to analyze data and look for meaningful insights.
Step 4: Use the collected data to improve as a team
The most effective place to discuss productivity metrics is the Sprint Retrospective. Having this in mind, Product Owners, Project Managers or other stakeholders should not have the mindset of “making the team work harder to increase productivity (velocity)” but rather trying to find the root cause of downfall in tracked metrics and find a solution as a team. This solution would then be visible in productivity increase. For example, your team can track Velocity across multiple sprints to identify whether it is rising and falling.
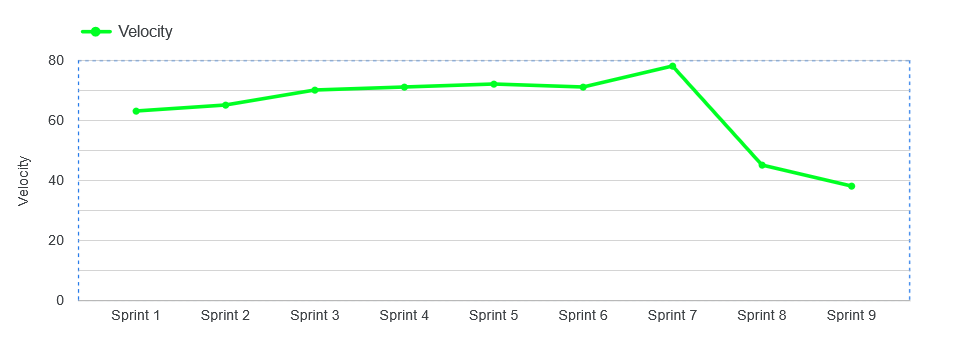
Example of a chart showing velocity changes over 9 sprints. Source: Author
Step 5: Iterate (and automate)
As the last step, repeat the process until your Agile team is working at an optimum level. Use your PM tools (such as Jira) or Git analytics (GitLab, GitHub) to generate metrics and charts automatically. Be consistent with using metrics, but most importantly – if one of your metrics is not providing insights that can lead to improvement, stop measuring it as it provides no use for you.
Common mistakes in usage of Agile productivity metrics
Story points are used to represent the mix of effort, complexity and risk related to a specific user story. If a team’s velocity increases, it suggests that this team is becoming more productive. But using it wrongly can lead to certain risks:
- Cross-team comparison: Comparing velocity of one team to another can give you the wrong impression. It’s like mixing apples and oranges. Since velocity is used as an internal baseline it is different for each team.
- Story points inflation: If the Product Owner asks a team to “be more productive,” the team might start estimating a 5-point story as an 8-point story. In reports productivity increase is visible. In reality nothing changed.
- Vague value delivered: Story Points do not represent business value delivered to customers, so we can’t really know customer value delivered. For this it’s better to use different metrics such as Business Value Points or Feature Adoption Rate.
While Lead time and Cycle time are good measures for tracking flow efficiency, they can be misinterpreted:
- Confusing the two terms – This is the most common mistake and can lead to wrong communication with stakeholders, for example telling your client that Cycle time is 10 days while he has to wait for new feature 60 days from entering it into backlog (Lead time)
- Ignoring waiting time – Cycle Time only measures when someone is actively working. If a task spends 2 hours being coded but 4 days waiting for a Code Review, the Cycle Time might look “fast” (2 hours), but the reality is a bottleneck.
- Not identifying the bottlenecks – Connected to the above mentioned, not identifying (and addressing) bottlenecks in the process can make your delivery slower. Cumulative Flow Diagram (CFD) is a useful tool for visualizing and spotting bottlenecks. In the below example, Cumulative Flow Diagram shows widening of bands that represent Testing, Bugfixing and Done phases between March 4th and March 7th. This can indicate that there is a bottleneck in the testing phase.
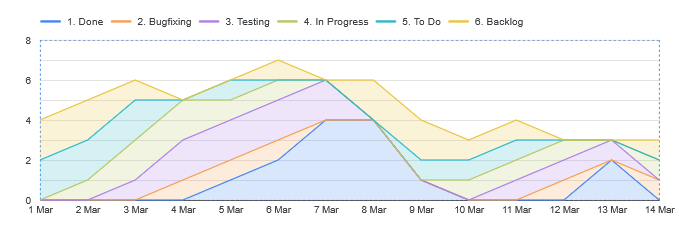
Example of Cumulative Flow Diagram showing bottleneck in testing phase of development.Source: Author
Is measuring productivity worth it in Agile?
When measuring productivity correctly (and avoiding common pitfalls) it can be a good indicator of the delivery an Agile team is making. In this blog post it’s shown which measures teams can use as well as how to implement them. Although productivity is an important aspect of Agile projects, it is not the only one teams need to track. In next posts we will describe in detail how Agile teams can measure Quality (“the cost of delivering quickly”) and Value (“what it means to the customer”).
Give Kudos by sharing the post!
ABOUT AUTHOR

Boris Figecki
Program Manager