If you’re tired of reading generic blogs about happy clients and engaged employees in the development world that never seem to give you a true sense of what it is really all about, don’t worry, we are too.
So keep on reading and find out if the link between “Customer Satisfaction” and “Employee Satisfaction” is a myth or a reality?
Q has been among the Top 20 agencies for over a year regarding customer satisfaction on the most relevant portal worldwide — Clutch. Furthermore, we are a part of the most exclusive network of the top 7% of agencies in the world – Pangea. Recently, the leading company for measuring employee engagement, Peakon, ranked Q among the Top 5% of IT companies in the world in terms of engagement of its employees. In addition, we were named The Best Employer in the region according to the employee satisfaction survey conducted by MojPosao.
Our goal here is not to brag about awards and recognitions, but to prove that the concrete steps in the approach to employees ultimately give tangible results. The four tips we will share with you below are eicient and useful. While some of them may not apply to every industry, practice with our clients has shown that most of them, in every environment, really create added value.
If you want to have satisfied customers, you have to invest in people. When people are happy and engaged, the customers are automatically more satisfied. And when the customers are satisfied, it is automatically more comfortable for your employees to work with them. This relationship creates a positive spiral — one pulls the other, and so on.
1. Keep Employees Engaged
Choose a good tool for measuring employee engagement that will be tailored to your company’s needs, and most importantly, monitor the data and react! We opted for Peakon, which allows us detailed insights and monitoring of progress.
We send the survey every month, and it contains a dozen questions oriented to some of the 14 drivers of engagement on a scale from 0 to 10, and in each round, we add a couple of open questions that we create ourselves. Some of the areas we monitor are Strategy, Development, Freedom of Opinion, Management Support, Wellbeing, but we also measure Loyalty, Satisfaction, and Belief in Q.
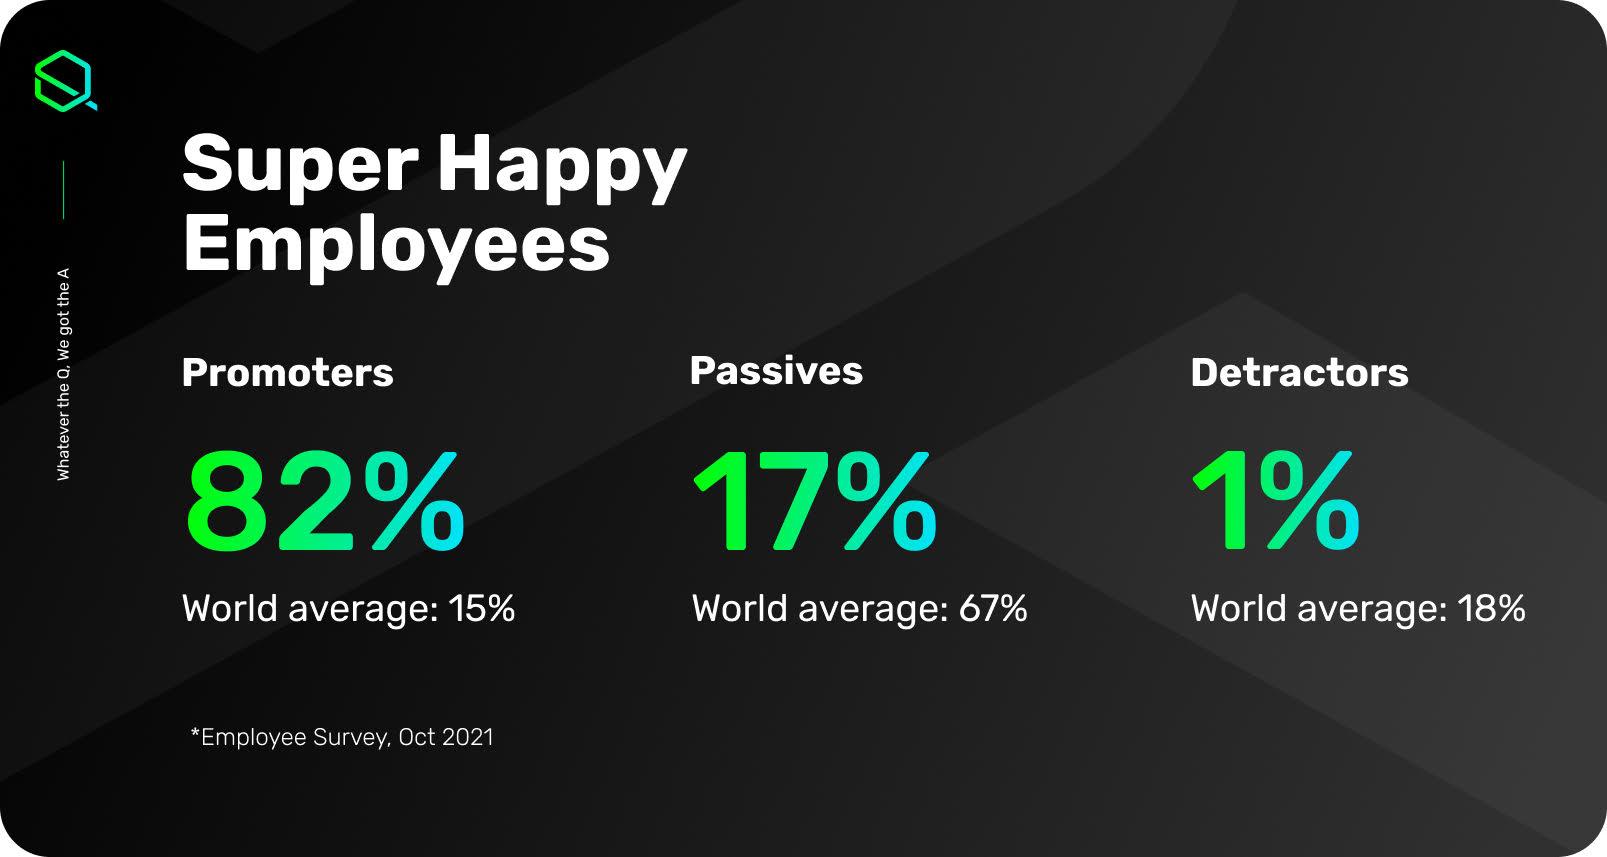
Net Promoter Score (NPS) is a metric you want to keep track of. We are proud that in the last survey, we have 82% of Promoters (engaged employees), 17% of Passive (not actively disengaged but still held back from applying their full-selves at work) and only 1% Detractors (disengaged employees). According to Gallup, the world average of Promoters is 15%, and the Croatian at only 13%, which shows that Q’s results are 600% above average!
2. Modify HR Initiatives Monthly
Earlier this year, the engagement score of our employees was 8.7. Today’s engagement score is an impressive 9.0 out of 10. Each month, we dedicate time to analyze results, share them with team leaders, communicate with employees through anonymous Peakon messages, resolve any objections, and adopt any feedback we get.
If you want to improve engagement, you need to listen to what people want and ask for. We learned the most by looking at the impact that specific drivers have on engagement. For example, Strategy, Rewarding, and Growth & Development have been shown to have the most significant impact on people’s satisfaction.
Such information has helped us steer our eorts and initiatives in the right direction. Having said that, we recorded an interview with our CEO dedicated exclusively to strategy. Each team leader discussed their vision of the strategy and the order in which the company is going. We have also introduced Performance Management to more systematically enable the growth, development, and rewarding of employees.
3. Listen to Your Customers
The basic premise of monitoring is simplicity and convenience, so we measure the satisfaction of all clients in Q once a month with simple surveys. We monitor 10 indicators through 4 main categories: Knowledge & Expertise, Passion & Commitment, Output Quality, and Communications. Don’t overengineer the process; make it simple.
All our clients complete the survey once a month, and it takes only 60 seconds. That way, minimum eort is required from the client, and we get a large set of data to follow the trend by markets, countries, types of projects, project managers, and others. For example, today, our client’s average Passion & Commitment rating is 9.8 / 10.0, and the total Employee Engagement Rate is 9.0 / 10.0. Both indicators have grown in parallel over the past few months.
Your team is a dream to deal with and provide a level of confidence beyond what any of us expected.
Lana Went, The Times
The ratings went up because we never forgot to process the data and see what we could do better the following month. It is important to react as soon as you get feedback. In this way, clients’ and employees’ opinions get acknowledged, and together we are able to work on improvements that will benefit us all. In addition to short and quick feedback surveys, we have Deep Dive Interviews twice a year where the client gives long and extensive feedback.

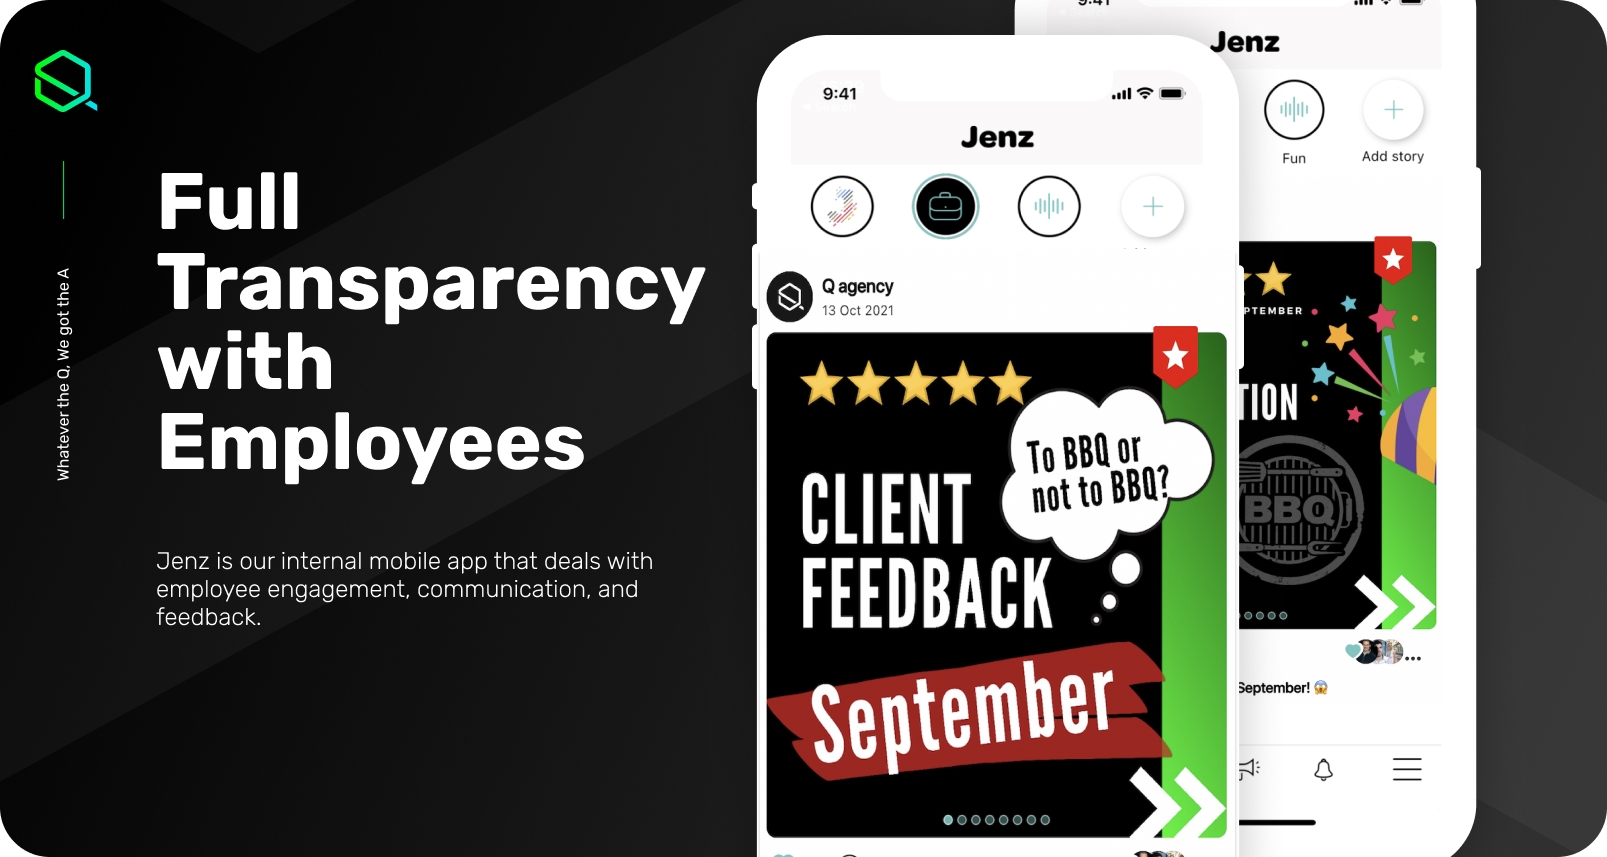
4. Full Transparency is Key
We do an analysis every month using the simple functionality of Google Sheets, and we display the results through 10 charts in Google Slides that are available to all key departments.
Project managers are in charge of communicating grades to the team. They also analyze in detail with the client each grade that is not excellent. In this way, we dedicate problems and raise satisfaction rates every month. Thus, threes become fours, and fours become fives, and over time, a positive growth trend can be seen.
We share the overall analysis and results with the entire company through the internal mobile app Jenz. We share the kudos we receive from the clients and transparently communicate them to everyone.
Conclusion
All these things live and work at Q. Before we launched these initiatives, our people were not overly satisfied. We were even below average. However, according to the global platform Clutch, Q is now one of the Top 20 Web Development Firms in terms of quality. Regarding employee satisfaction, in just one year, we managed to become The Best Employer in the region according to the survey conducted by MojPosao.
All of that enabled us to grow our revenues steadily year-over-year with the growth rate continuously being over 50%.
I hope these tips and experiences will inspire you to make a turnaround in your company. We will not lie, all of this requires time and resources, but we have proven that the link between “Customer Satisfaction” and “Employee Satisfaction” really exists. So, to conclude, don’t forget to make changes – they come from within.
Give Kudos by sharing the post!
ABOUT AUTHOR

Paula Kovacevic
Head of Operations